I recently had a question from a colleague, and thanks to the awesome recent work on rlang this is now super straightforward. I thought I’d share a bit about that.
I still remember when I had just learnt how to write a function in R, and I wanted to do the thing where you use a function argument that isn’t a string but it just didn’t work.
And I didn’t know how to talk about it.
And the people I showed it to didn’t either.
It was confusing, and frustrating. I wanted to sling some magic around, like I’d seen in ggplot.
It looked something like this:
library(ggplot2)
gg_hist <- function(data, x){
  ggplot(data,
         aes(x)) +
    geom_histogram()
}

gg_hist(mtcars, mpg)
#> Don't know how to automatically pick scale for object of type tbl_df/tbl/data.frame. Defaulting to continuous.
#> Error: Aesthetics must be either length 1 or the same as the data (32): x
I was all, “How do I pass the x thing? And it was confusing.
I could do this though,
gg_hist <- function(data, x){
    ggplot(data,
         aes_string(x)) +
    geom_histogram()
}

gg_hist(mtcars, "mpg")
## `stat_bin()` using `bins = 30`. Pick better value with `binwidth`.

Fine. Right?
Well, kinda?
I wanted that nice, clean way of referring to the variable not in quotes - I didn’t know what to call it then, but nowadays I’d call it a “bare variable” or “symbol”.
It was frustrating, and a real road block.
But now, there is a way around this, and I really like it. It’s the curly-curly:

Curly, from the three stooges
For it to work, you’ll need rlang version 0.4.0
First, you write library(rlang).
library(rlang)
gg_hist <- function(data, x){
  ggplot(data,
         aes(x = {{ x }} )) +
    geom_histogram()
}

gg_hist(mtcars, mpg)
## `stat_bin()` using `bins = 30`. Pick better value with `binwidth`.
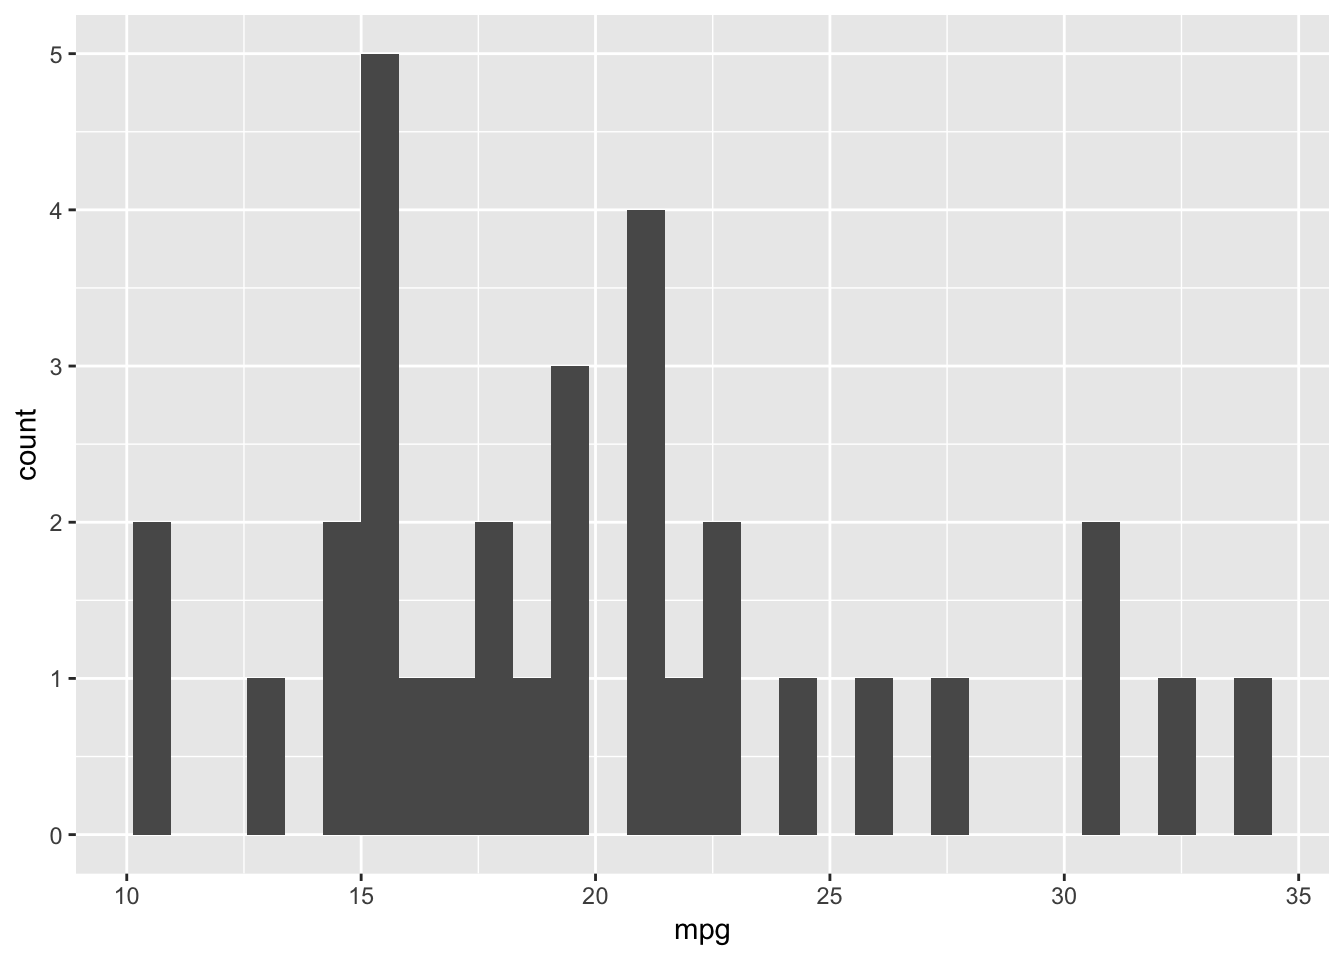
You put the variable that you want to refer to in the “bare” form inside two curly braces. That’s it. It’s magic.
Here’s another example, which I’m pretty sure I saw on a twitter thread with IsabellaGhement:
scatter_plot <- function(data, x, y){
  ggplot(data,
         aes(x = {{ x }} ,
             y = {{ y }} )) +
    geom_point()
}

scatter_plot(mtcars, mpg, disp)
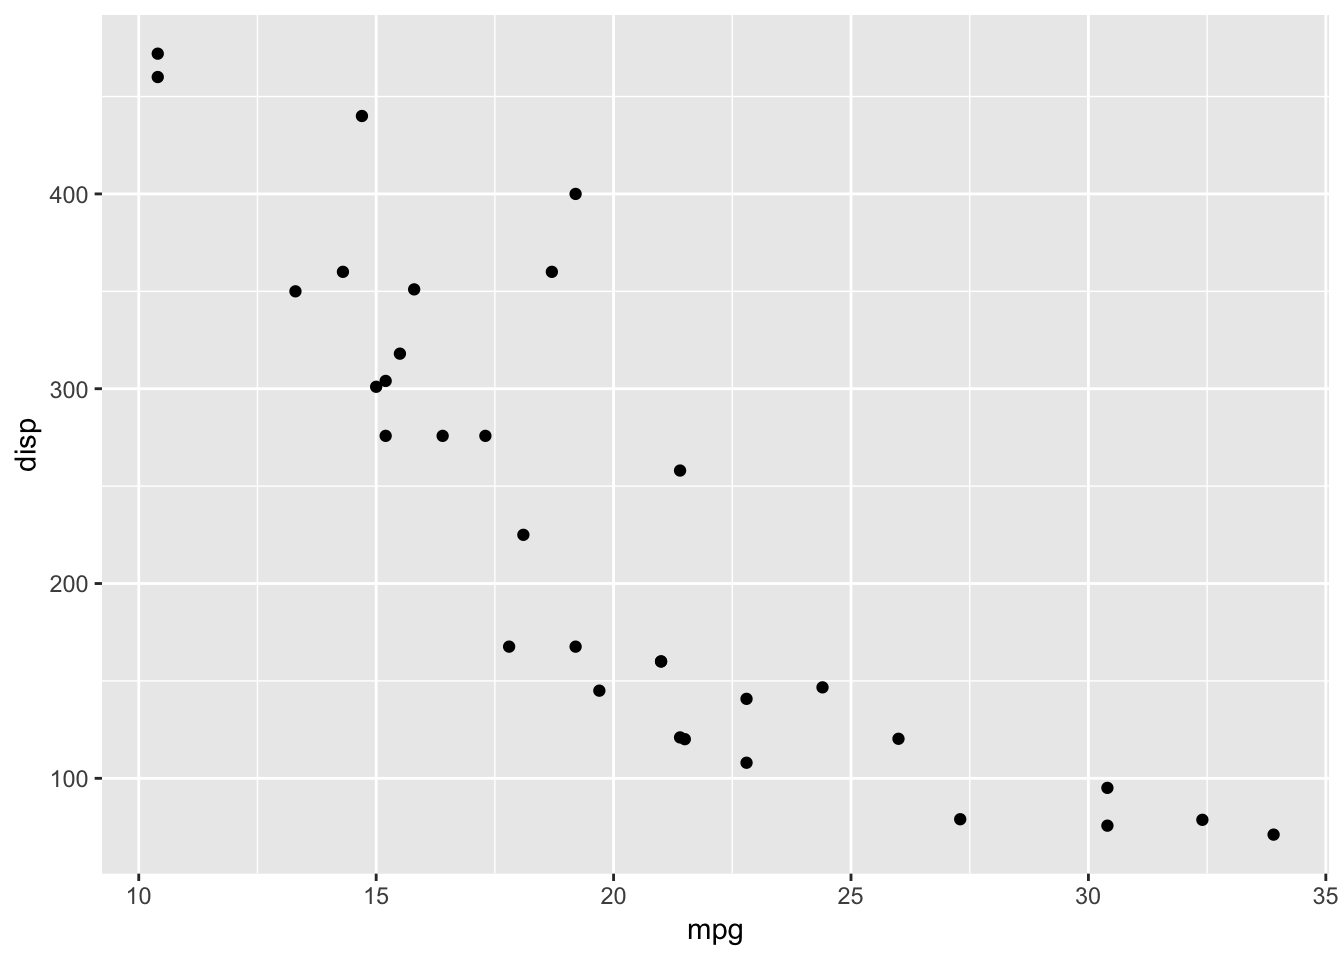
How freaking cool is this?