It is with great pleasure that I can say that naniar version 0.2.0 (“The First Joke and Other Matters”) is now on CRAN!

While I’m at it - naniar also has a nice hex sticker, thanks to Oz Locke of Cuddly Cthulhu for the design, I’m super happy with it!

It is inspired by the lampost from CS Lewis’ “Narnia”, and highlights that it focusses on NA values, as well as this idea of “shining a light” on missing data, whilst containing a missing piece.

If you’d like a hex sticker, send me an email and I’ll happily mail one to you!
So, what is naniar?
naniar is a tidyverse friendly package for exploring and analysing missing data in R. The current goals of the naniar package is to make it easier for users to:
- Clean up, tidy, and recode missing values
- Find where missing data is
- Establish how much missing data they is
- Explore why data is missing
- Evaluate imputed values
I’ve described this process in the vignette “getting started”, which I recommend you take a look at to get a quick overview of the capabilities in naniar.
What is new in version 0.2.0?
Scan for possible missing values with miss_scan_count.
miss_scan_count makes it easier for users to search for particular
occurences of values in a dataset, across variables. This is handy when you think you might have some suspect values in your dataset and you want to see if they appear in the dataset.
Let’s create a small dataframe containing some offending features, such as -99, and “N/A”, to show how this works:
dat_test <- tibble::tribble(~x,  ~y,    ~z,
                            1,   "A",   -100,
                            3,   "N/A", -99,
                            NA,  NA,    -98,
                            -99, "E",   -101,
                            -98, "F",   -1)
You specify the things you want to scan for with the “search” argument, which takes a vector, and counts the number of times those features appear in each column.
So, for example, we cna look at the number of times that -99 appears in a dataset.
library(naniar)

miss_scan_count(data = dat_test, search = -99)
## # A tibble: 3 x 2
##   Variable     n
##   <chr>    <int>
## 1 x            1
## 2 y            0
## 3 z            1
This tells us that we have -99 appearing in the variables x and z.
We can also look at the number of times that we have -99, -98, and “N/A”.
miss_scan_count(data = dat_test, search = c(-99,-98,"N/A"))
## # A tibble: 3 x 2
##   Variable     n
##   <chr>    <int>
## 1 x            2
## 2 y            1
## 3 z            2
This tells us that at least one of these values appears in x twice, y once, and z twice.
What to do once you find these values?
Replace values with NA
You can use the new “scoped variants” of replace_with_na to find and replace particular values with an NA value. Thankyou to Colin Fay for his valuable work on this!
replace_with_na_all
Replace all NAs across the dataframe that meet a specified condition, using the syntax ~.x == -99.
dat_test %>%
  replace_with_na_all(~.x == -99)
## # A tibble: 5 x 3
##        x y           z
##    <dbl> <chr>   <dbl>
## 1   1.00 A     -100
## 2   3.00 N/A     NA
## 3  NA    <NA>  - 98.0
## 4  NA    E     -101
## 5 -98.0  F     -  1.00
replace_with_na_at
Replace all NAs across for specified variables
dat_test %>%
  replace_with_na_at(.vars = "z",
                     condition = ~.x == -99)
## # A tibble: 5 x 3
##        x y           z
##    <dbl> <chr>   <dbl>
## 1   1.00 A     -100
## 2   3.00 N/A     NA
## 3  NA    <NA>  - 98.0
## 4 -99.0  E     -101
## 5 -98.0  F     -  1.00
replace_with_na_if
Replace all NAs for those variables that satisfy some predicate function (e.g., is.character)
dat_test %>%
  replace_with_na_if(.predicate = is.character,
                     condition = ~.x == "N/A")
## # A tibble: 5 x 3
##        x y           z
##    <dbl> <chr>   <dbl>
## 1   1.00 A     -100
## 2   3.00 <NA>  - 99.0
## 3  NA    <NA>  - 98.0
## 4 -99.0  E     -101
## 5 -98.0  F     -  1.00
You can read more in the vignette “replace with NA”
Speed improvements:
Thanks to the help, contributions, and discussion with Romain François and Jim Hester, naniar now has greatly improved speed for calculating the missingness in each row (at least an order of magnitude!). These speedups should continue to improve in future releases.
Convenience functions
n_miss_row
Calculate the number of missing values in each row, returning a vector.
n_miss_row(airquality)
##   [1] 0 0 0 0 2 1 0 0 0 1 1 0 0 0 0 0 0 0 0 0 0 0 0 0 1 1 2 0 0 0 0 1 1 1 1
##  [36] 1 1 0 1 0 0 1 1 0 1 1 0 0 0 0 0 1 1 1 1 1 1 1 1 1 1 0 0 0 1 0 0 0 0 0
##  [71] 0 1 0 0 1 0 0 0 0 0 0 0 1 1 0 0 0 0 0 0 0 0 0 0 0 1 1 1 0 0 0 1 1 0 0
## [106] 0 1 0 0 0 0 0 0 0 1 0 0 0 1 0 0 0 0 0 0 0 0 0 0 0 0 0 0 0 0 0 0 0 0 0
## [141] 0 0 0 0 0 0 0 0 0 1 0 0 0
There are also 3 other functions which are similar in spirit.
n_complete_row
Return a vector of the number of complete obserations,
n_complete_row(airquality)
##   [1] 6 6 6 6 4 5 6 6 6 5 5 6 6 6 6 6 6 6 6 6 6 6 6 6 5 5 4 6 6 6 6 5 5 5 5
##  [36] 5 5 6 5 6 6 5 5 6 5 5 6 6 6 6 6 5 5 5 5 5 5 5 5 5 5 6 6 6 5 6 6 6 6 6
##  [71] 6 5 6 6 5 6 6 6 6 6 6 6 5 5 6 6 6 6 6 6 6 6 6 6 6 5 5 5 6 6 6 5 5 6 6
## [106] 6 5 6 6 6 6 6 6 6 5 6 6 6 5 6 6 6 6 6 6 6 6 6 6 6 6 6 6 6 6 6 6 6 6 6
## [141] 6 6 6 6 6 6 6 6 6 5 6 6 6
prop_miss_row
Return the proportion of missings in a row
prop_miss_row(airquality)
##   [1] 0.0000000 0.0000000 0.0000000 0.0000000 0.3333333 0.1666667 0.0000000
##   [8] 0.0000000 0.0000000 0.1666667 0.1666667 0.0000000 0.0000000 0.0000000
##  [15] 0.0000000 0.0000000 0.0000000 0.0000000 0.0000000 0.0000000 0.0000000
##  [22] 0.0000000 0.0000000 0.0000000 0.1666667 0.1666667 0.3333333 0.0000000
##  [29] 0.0000000 0.0000000 0.0000000 0.1666667 0.1666667 0.1666667 0.1666667
##  [36] 0.1666667 0.1666667 0.0000000 0.1666667 0.0000000 0.0000000 0.1666667
##  [43] 0.1666667 0.0000000 0.1666667 0.1666667 0.0000000 0.0000000 0.0000000
##  [50] 0.0000000 0.0000000 0.1666667 0.1666667 0.1666667 0.1666667 0.1666667
##  [57] 0.1666667 0.1666667 0.1666667 0.1666667 0.1666667 0.0000000 0.0000000
##  [64] 0.0000000 0.1666667 0.0000000 0.0000000 0.0000000 0.0000000 0.0000000
##  [71] 0.0000000 0.1666667 0.0000000 0.0000000 0.1666667 0.0000000 0.0000000
##  [78] 0.0000000 0.0000000 0.0000000 0.0000000 0.0000000 0.1666667 0.1666667
##  [85] 0.0000000 0.0000000 0.0000000 0.0000000 0.0000000 0.0000000 0.0000000
##  [92] 0.0000000 0.0000000 0.0000000 0.0000000 0.1666667 0.1666667 0.1666667
##  [99] 0.0000000 0.0000000 0.0000000 0.1666667 0.1666667 0.0000000 0.0000000
## [106] 0.0000000 0.1666667 0.0000000 0.0000000 0.0000000 0.0000000 0.0000000
## [113] 0.0000000 0.0000000 0.1666667 0.0000000 0.0000000 0.0000000 0.1666667
## [120] 0.0000000 0.0000000 0.0000000 0.0000000 0.0000000 0.0000000 0.0000000
## [127] 0.0000000 0.0000000 0.0000000 0.0000000 0.0000000 0.0000000 0.0000000
## [134] 0.0000000 0.0000000 0.0000000 0.0000000 0.0000000 0.0000000 0.0000000
## [141] 0.0000000 0.0000000 0.0000000 0.0000000 0.0000000 0.0000000 0.0000000
## [148] 0.0000000 0.0000000 0.1666667 0.0000000 0.0000000 0.0000000
prop_complete_row
Return the proportion of complete obserations in a row.
prop_complete_row(airquality)
##   [1] 1.0000000 1.0000000 1.0000000 1.0000000 0.6666667 0.8333333 1.0000000
##   [8] 1.0000000 1.0000000 0.8333333 0.8333333 1.0000000 1.0000000 1.0000000
##  [15] 1.0000000 1.0000000 1.0000000 1.0000000 1.0000000 1.0000000 1.0000000
##  [22] 1.0000000 1.0000000 1.0000000 0.8333333 0.8333333 0.6666667 1.0000000
##  [29] 1.0000000 1.0000000 1.0000000 0.8333333 0.8333333 0.8333333 0.8333333
##  [36] 0.8333333 0.8333333 1.0000000 0.8333333 1.0000000 1.0000000 0.8333333
##  [43] 0.8333333 1.0000000 0.8333333 0.8333333 1.0000000 1.0000000 1.0000000
##  [50] 1.0000000 1.0000000 0.8333333 0.8333333 0.8333333 0.8333333 0.8333333
##  [57] 0.8333333 0.8333333 0.8333333 0.8333333 0.8333333 1.0000000 1.0000000
##  [64] 1.0000000 0.8333333 1.0000000 1.0000000 1.0000000 1.0000000 1.0000000
##  [71] 1.0000000 0.8333333 1.0000000 1.0000000 0.8333333 1.0000000 1.0000000
##  [78] 1.0000000 1.0000000 1.0000000 1.0000000 1.0000000 0.8333333 0.8333333
##  [85] 1.0000000 1.0000000 1.0000000 1.0000000 1.0000000 1.0000000 1.0000000
##  [92] 1.0000000 1.0000000 1.0000000 1.0000000 0.8333333 0.8333333 0.8333333
##  [99] 1.0000000 1.0000000 1.0000000 0.8333333 0.8333333 1.0000000 1.0000000
## [106] 1.0000000 0.8333333 1.0000000 1.0000000 1.0000000 1.0000000 1.0000000
## [113] 1.0000000 1.0000000 0.8333333 1.0000000 1.0000000 1.0000000 0.8333333
## [120] 1.0000000 1.0000000 1.0000000 1.0000000 1.0000000 1.0000000 1.0000000
## [127] 1.0000000 1.0000000 1.0000000 1.0000000 1.0000000 1.0000000 1.0000000
## [134] 1.0000000 1.0000000 1.0000000 1.0000000 1.0000000 1.0000000 1.0000000
## [141] 1.0000000 1.0000000 1.0000000 1.0000000 1.0000000 1.0000000 1.0000000
## [148] 1.0000000 1.0000000 0.8333333 1.0000000 1.0000000 1.0000000
Calculate missingness clusters
add_miss_cluster
This calculates a cluster of missingnessfor each row, using hclust. This can be useful in exploratory modelling of missingness, similar to Tierney et al 2015. and Barnett et al. 2017
add_miss_cluster(airquality)
## # A tibble: 153 x 7
##    Ozone Solar.R  Wind  Temp Month   Day miss_cluster
##    <int>   <int> <dbl> <int> <int> <int>        <int>
##  1    41     190  7.40    67     5     1            1
##  2    36     118  8.00    72     5     2            1
##  3    12     149 12.6     74     5     3            1
##  4    18     313 11.5     62     5     4            1
##  5    NA      NA 14.3     56     5     5            2
##  6    28      NA 14.9     66     5     6            1
##  7    23     299  8.60    65     5     7            1
##  8    19      99 13.8     59     5     8            1
##  9     8      19 20.1     61     5     9            1
## 10    NA     194  8.60    69     5    10            2
## # ... with 143 more rows
You can constrain the number of clusters with n_clusters
add_miss_cluster(airquality,
                 n_clusters = 3)
## # A tibble: 153 x 7
##    Ozone Solar.R  Wind  Temp Month   Day miss_cluster
##    <int>   <int> <dbl> <int> <int> <int>        <int>
##  1    41     190  7.40    67     5     1            1
##  2    36     118  8.00    72     5     2            1
##  3    12     149 12.6     74     5     3            1
##  4    18     313 11.5     62     5     4            1
##  5    NA      NA 14.3     56     5     5            2
##  6    28      NA 14.9     66     5     6            1
##  7    23     299  8.60    65     5     7            1
##  8    19      99 13.8     59     5     8            1
##  9     8      19 20.1     61     5     9            1
## 10    NA     194  8.60    69     5    10            3
## # ... with 143 more rows
And also specify the cluster method, with cluster_method
add_miss_cluster(airquality,
                 cluster_method = "ward.D")
## # A tibble: 153 x 7
##    Ozone Solar.R  Wind  Temp Month   Day miss_cluster
##    <int>   <int> <dbl> <int> <int> <int>        <int>
##  1    41     190  7.40    67     5     1            1
##  2    36     118  8.00    72     5     2            1
##  3    12     149 12.6     74     5     3            1
##  4    18     313 11.5     62     5     4            1
##  5    NA      NA 14.3     56     5     5            1
##  6    28      NA 14.9     66     5     6            1
##  7    23     299  8.60    65     5     7            1
##  8    19      99 13.8     59     5     8            1
##  9     8      19 20.1     61     5     9            1
## 10    NA     194  8.60    69     5    10            2
## # ... with 143 more rows
these options are taken from the stats::hclust helpfile, and include: “ward.D”, “ward.D2”, “single”, “complete”, “average” (= UPGMA), “mcquitty” (= WPGMA), “median” (= WPGMC) or “centroid” (= UPGMC).
Little things
which_na
A replacement for which(is.na(x)),
which_na(airquality)
##  [1]   5  10  25  26  27  32  33  34  35  36  37  39  42  43  45  46  52
## [18]  53  54  55  56  57  58  59  60  61  65  72  75  83  84 102 103 107
## [35] 115 119 150 158 159 164 180 249 250 251
where_na
A function that returns the positions of NA values.
For a dataframe it returns a matrix of row and col positions of NAs, and for a vector it returns a vector of positions of NAs.
where_na(airquality)
##       row col
##  [1,]   5   1
##  [2,]  10   1
##  [3,]  25   1
##  [4,]  26   1
##  [5,]  27   1
##  [6,]  32   1
##  [7,]  33   1
##  [8,]  34   1
##  [9,]  35   1
## [10,]  36   1
## [11,]  37   1
## [12,]  39   1
## [13,]  42   1
## [14,]  43   1
## [15,]  45   1
## [16,]  46   1
## [17,]  52   1
## [18,]  53   1
## [19,]  54   1
## [20,]  55   1
## [21,]  56   1
## [22,]  57   1
## [23,]  58   1
## [24,]  59   1
## [25,]  60   1
## [26,]  61   1
## [27,]  65   1
## [28,]  72   1
## [29,]  75   1
## [30,]  83   1
## [31,]  84   1
## [32,] 102   1
## [33,] 103   1
## [34,] 107   1
## [35,] 115   1
## [36,] 119   1
## [37,] 150   1
## [38,]   5   2
## [39,]   6   2
## [40,]  11   2
## [41,]  27   2
## [42,]  96   2
## [43,]  97   2
## [44,]  98   2
bind_shadow gains an only_miss argument.
When set to FALSE (the default) it will bind a dataframe with all of the variables duplicated with their shadow. Setting this to TRUE will bind variables only those variables that contain missing values.
bind_shadow(dat_test)
## # A tibble: 5 x 6
##        x y           z x_NA  y_NA  z_NA
##    <dbl> <chr>   <dbl> <fct> <fct> <fct>
## 1   1.00 A     -100    !NA   !NA   !NA
## 2   3.00 N/A   - 99.0  !NA   !NA   !NA
## 3  NA    <NA>  - 98.0  NA    NA    !NA
## 4 -99.0  E     -101    !NA   !NA   !NA
## 5 -98.0  F     -  1.00 !NA   !NA   !NA
bind_shadow(dat_test, only_miss = TRUE)
## # A tibble: 5 x 5
##        x y           z x_NA  y_NA
##    <dbl> <chr>   <dbl> <fct> <fct>
## 1   1.00 A     -100    !NA   !NA
## 2   3.00 N/A   - 99.0  !NA   !NA
## 3  NA    <NA>  - 98.0  NA    NA
## 4 -99.0  E     -101    !NA   !NA
## 5 -98.0  F     -  1.00 !NA   !NA
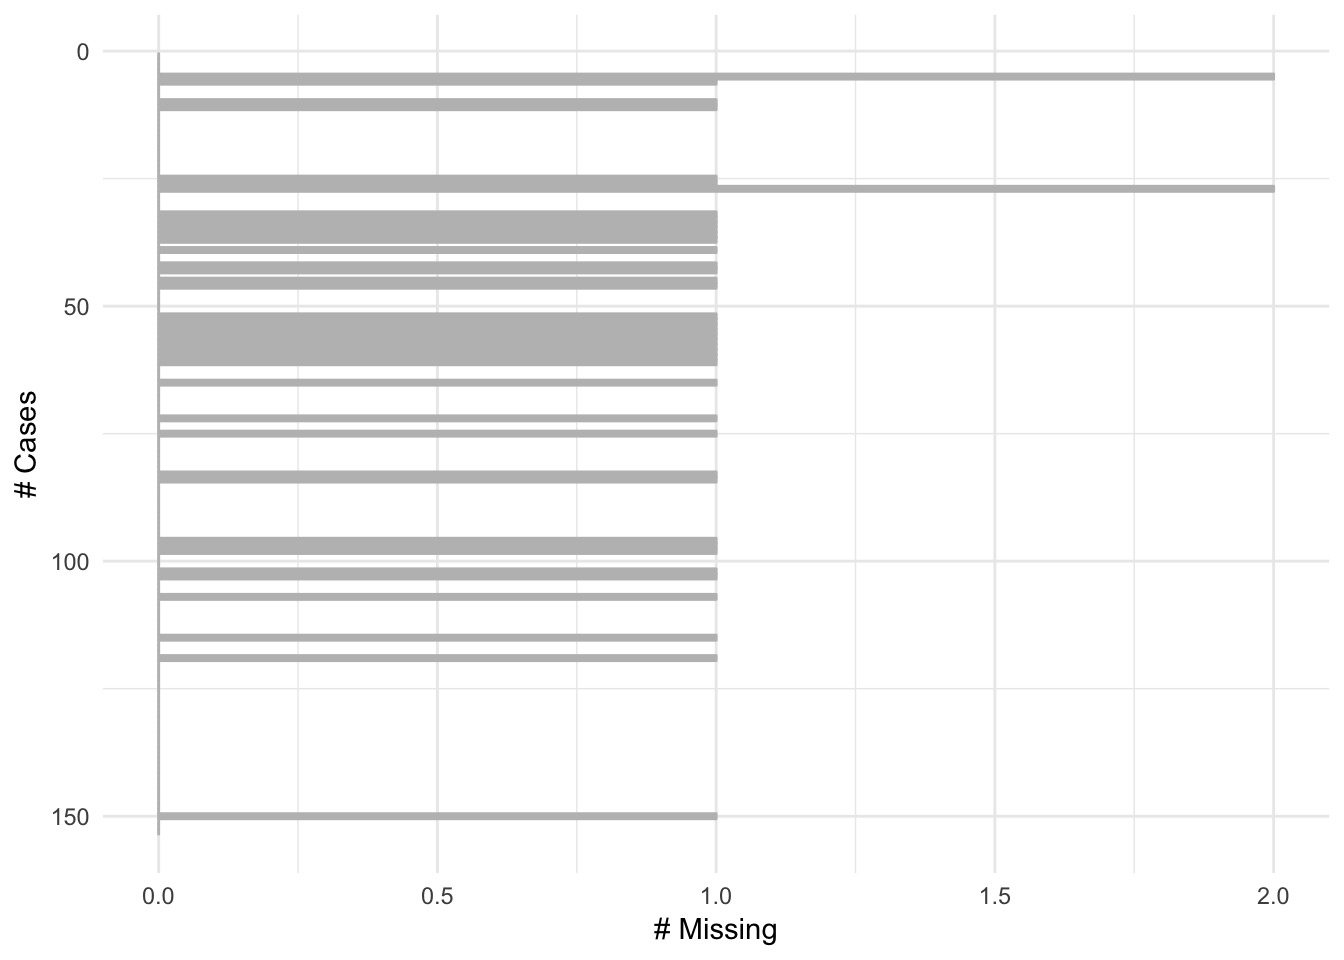
Cleaned up the visualisation of gg_miss_case
It is now clearer and less cluttered ( #117)
gg_miss_case(airquality)
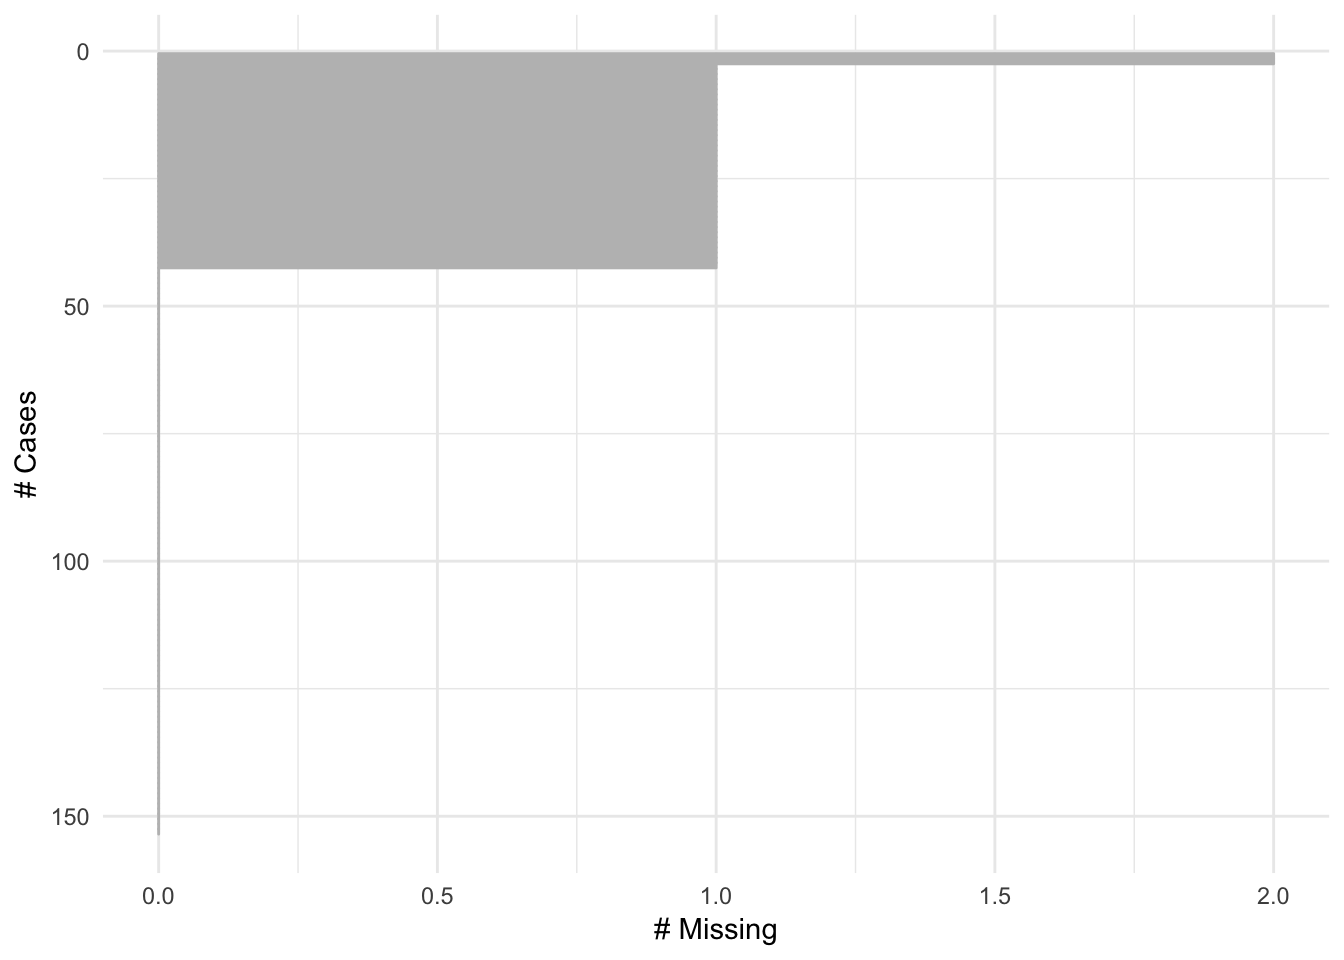
also added n order_cases option to order by cases.
gg_miss_case(airquality, order_cases = TRUE)
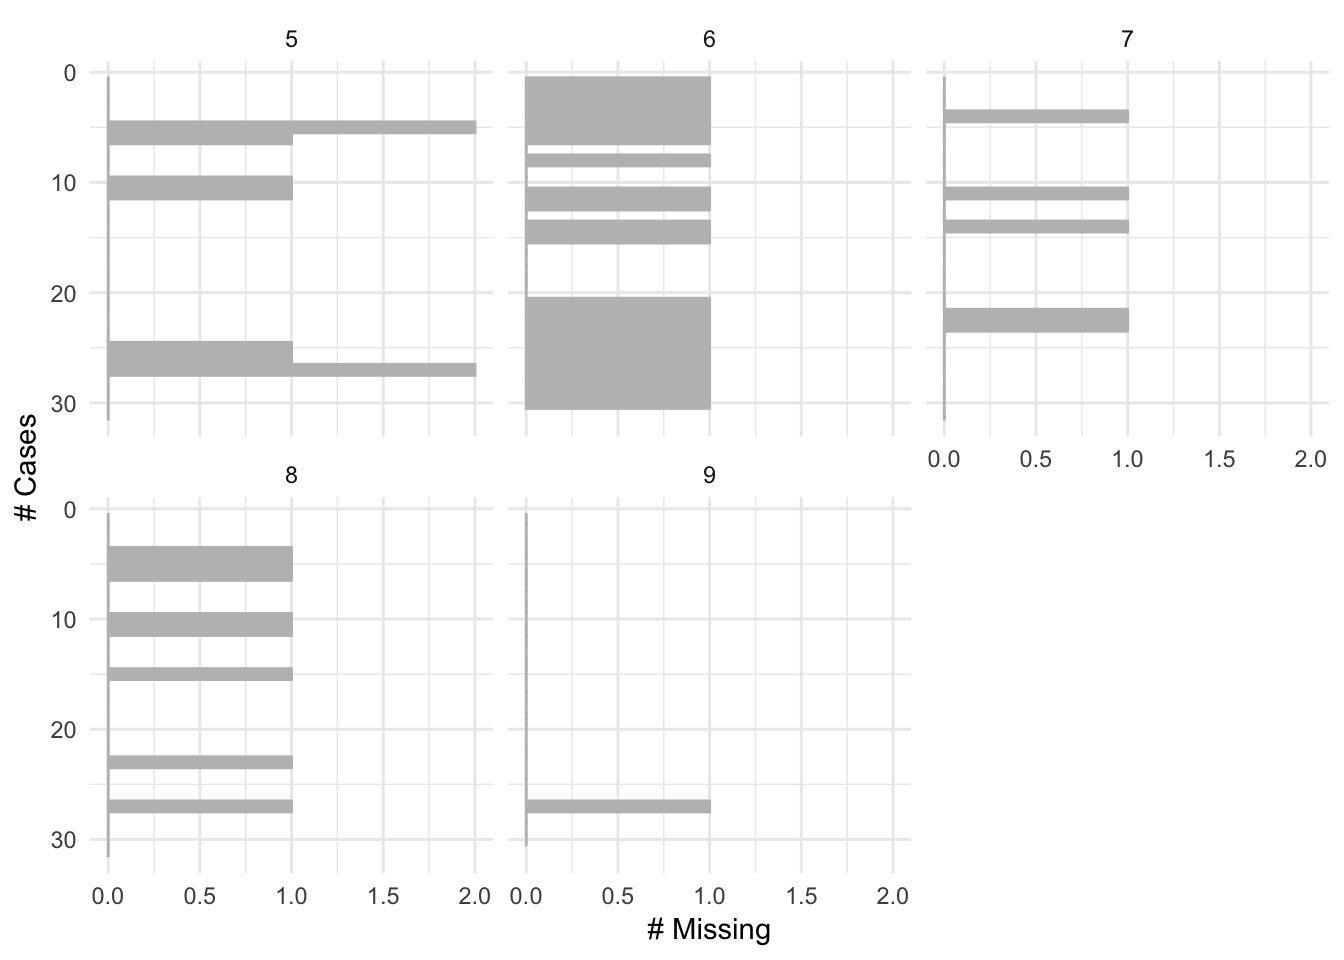
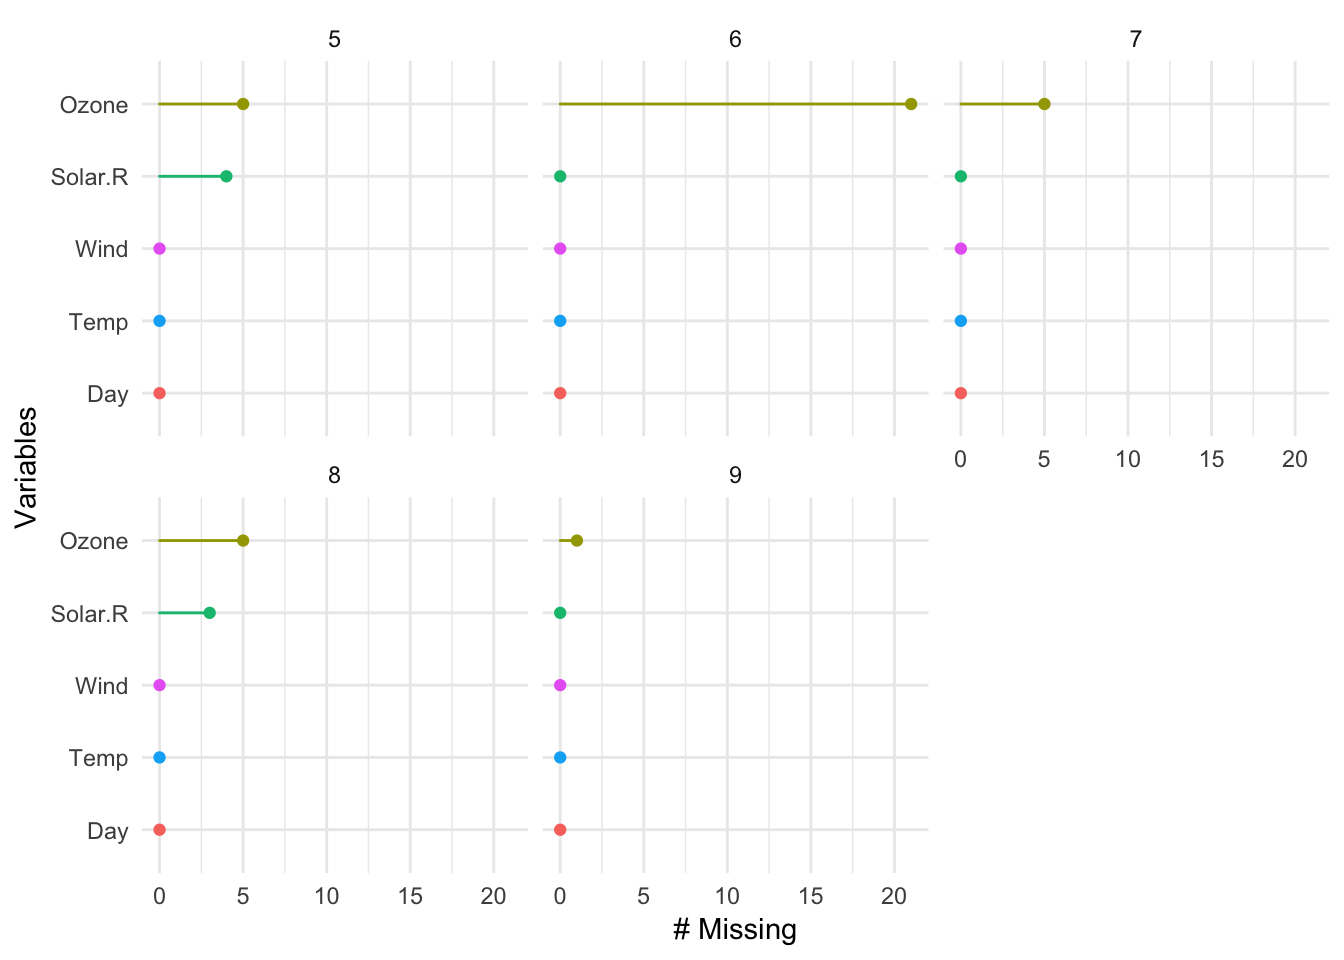
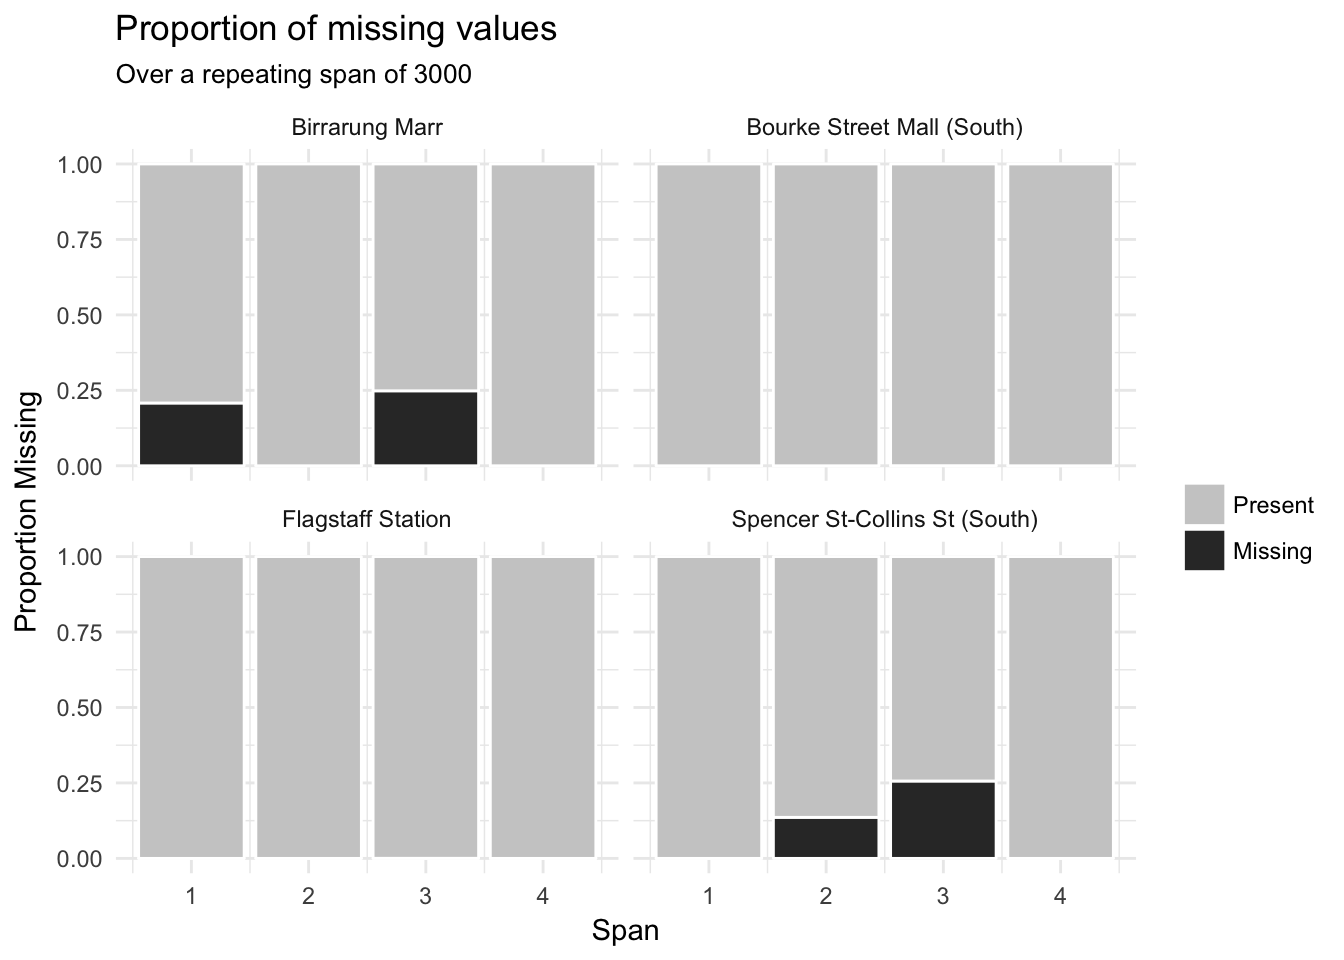
Added a facet argument to gg_miss_var, gg_miss_case, and gg_miss_span.
This makes it easier for users to visualise these plots across the values of another variable. In the future I will consider adding facet to the other shorthand plotting function, but at the moment these seemed to be the ones that would benefit the most from this feature.
gg_miss_case(airquality, facet = Month)
gg_miss_var(airquality, facet = Month)
gg_miss_span(pedestrian,
             hourly_counts,
             span_every = 3000,
             facet = sensor_name)
Updated the vignette “Gallery of Missing Data Visualisations” to include the facet features and order_cases.
- Update vignettes to have floating menu and better figure size.
- minor changes to graphics in gg_miss_fct - change legend title from “Percent Missing” to “% Miss”.
Bug fixes
oceanbuoysnow is numeric type for year, latitude, and longitude, previously it was factor. #110- Improved handling of
shadow_shiftwhen there are Inf or -Inf values #117
Breaking changes
After some consideration, I have deprecated replace_to_na, with replace_with_na, as it is a more natural phrase (“replace coffee to tea” vs “replace coffee with tea”), especially considering the scoped variants. replace_to_na will be made defunct in the next version of naniar.
cast_shadow no longer works when called as cast_shadow(data). This action used to return all variables, and then shadow variables for the variables that only contained missing values. This was inconsistent with the use of cast_shadow(data, var1, var2). A new option has been added to bind_shadow that controls this - discussed below. See more details at
issue 65.
Change behaviour of cast_shadow so that the default option is to return only the variables that contain missings. This is different to bind_shadow, which binds a complete shadow matrix to the dataframe. A way to think about this is that the shadow is only cast on variables that contain missing values, whereas a bind is binding a complete shadow to the data. This may change in the future to be the default option for bind_shadow.
Thank you!
Thank you to everyone who has filed issues, bug reports, made pull requests, and used naniar. The next release of naniar, version 0.3.0 should be released in March, and will include some cool features, which you can read about here.
Feedback wanted!

I’m really keen to get feedback on how you use naniar - I want to make this as easy to use for any many people as I can. Please feel free to file an issue on github if you have a bug or feature request, or put something on stack overflow, which I will be now be monitoring more closely.